PALIMPSESTS
Toward a Deep Map of Chang’an: Some Reflections of a (Beginning) Practitioner

Chang’an (modern Xi’an, Shaanxi province) is one of the most renowned cities in Chinese history. It was the capital of the Western Han (202 BCE–8 CE) and the Tang (618–907) dynasties: the twin peaks of imperial power in premodern China. In its heyday during the Tang dynasty, the area covered by the walled city (84.1 square kilometers) was even bigger than many modern metropoles, such as the island of Manhattan (59.1 square kilometers). When you visit the modern city Xi’an now, you can still see the remnants of the Han dynasty city of Chang’an to the northwest of the modern city center and, much more prominently, of the Tang city of Chang’an that overlaps with a large part of the modern city. As I witnessed firsthand walking the crowded streets of Xi’an during the sweltering summer of 2023, there is a tremendous amount of interest in the history of Chang’an among the general population, partly because of the remains of the ancient city, partly triggered by fictional works like the popular novel and TV drama The Longest Day in Chang’an.
Because of Chang’an’s historical significance, there have been efforts to map it since the Han dynasty.1 The earliest extant maps date to 1080 in the Northern Song dynasty (960–1127), when a group of local elites created a map of the city itself and maps of the palaces.2 These maps are also the earliest city maps in Chinese history. Subsequently, maps of Chang’an were made often as a part of a “local gazetteer,” a kind of geographically based compilation of local historical information.3 Such production continued into, and in many cases beyond, the Qing dynasty (1644–1911). In the twentieth century, historians and geographers began producing a kind of “historical map” (lishi ditu) that was intended to show the geographical contours of a place in a specific historical period. Chang’an, once again, was a center of scholarly interest in the production of such maps.4
During the building of an extensive subway system in 2006, many ancient tombs, old sites, and forgotten treasure hoards were excavated and rediscovered.
Yet, two trends that accelerated in the late twentieth century threaten to make these thoughtfully crafted historical maps obsolete, while offering new opportunities to reconceptualize how we represent Chang’an geographically. The first is new archaeological discoveries that have been appearing at a breathtaking pace. Because of the explosive economic development of Xi’an in the past half century and the accompanying construction of new infrastructure — notably during the building of an extensive subway system in 2006 — many ancient tombs, old sites, and forgotten treasure hoards were excavated and rediscovered. In the span of one year from 2021 to 2022, for instance, archaeologists found over 1,200 old tombs just from the west side of the city.5 These finds substantially changed our understanding of the shape of the city. When I visited an archaeological site in the summer of 2023, I observed how archaeologists uncovered a previously unknown section of the Zhuque boulevard — the main north-south axis of the Tang city — and found five unrecorded bridges over the boulevard. Such new discoveries far outpace the revision of traditional print books and atlases and cannot be properly and promptly reflected in these works.
At the same time, the development of GIS (Geographic Information System) technology, the use of portable GPS devises, app-based location services, and new developments in the field of digital humanities also made it possible to imagine a new kind of “deep map” that can incorporate and consolidate a huge amount of data, and to visualize them in ways that are easy to digest and manipulate. This deep map ideally will incorporate all the existing historical data about Chang’an, store and organize those textual, visual, and archaeological data in accessible and sensible ways, and visualize them in various forms for open-access use. This essay reflects some of my initial thinking as I begin to conceptualize this project, one that is certainly beyond the capacity of one person. To do so, I first examine existing maps of Chang’an produced by premodern cartographers and modern scholars, and discuss their uses and limits. Then I assess the nature of the data now at our disposal that are the basis of a “deep map” of Chang’an, and envision what kind of things this new map can do for us, as researchers, students, and even tourists of modern Xi’an.
Existing Historical Maps
To make new maps, we need to understand what “old” maps look like. Although maps were continuously made about Chang’an from the Han to the Tang dynasties, the earliest preserved map of Chang’an dates, as mentioned earlier, to the eleventh and twelfth century in the Northern Song dynasty (960–1127). Along with the map itself, a colophon was carved on a stone and preserved in later written sources, that allows us to understand the cartographic thinking of its creators. According to the colophon, the “principle” (fa 法) for the production of this map is as follows:6
The Sui capital city (which later became the Tang capital city) itself and the Daming Palace (a Tang palace located to the northeast of the capital city) are both converted on the scale of one li (about 460 meters) to two cun (each cun is about three centimeters). For [areas] outside of the city that are incorporated into the map, such principle of conversion does not apply. [This map] is largely based on old maps and the Record of the Western Capital by Wei Shu; we also consulted many other books and investigated traces of old sites. This conversion method does not allow us to show the many halls . . . within the three Palaces, the Taiji, the Daming, and the Xingqing, so we made additional maps [for these three Palaces].
The colophon then continues to record the sizes of the Han dynasty Chang’an, which was included in the map, and of the Tang city, along with the number of wards in the city, the lengths and heights of walls, and the names of city gates. From this colophon, we learn two lessons about the principle of making this map of Chang’an.
This early map of Chang’an was created on the basis of textual evidence, earlier maps, ground surveys, and possibly even archaeological data.
First, the eleventh-century cartographers made use of a wide range of data, including old maps (presumably those made in the Tang dynasty), textual records of Chang’an (especially the Record of the Western Capital composed by a Tang author Wei Shu in 722),7 and personal investigations of extant sites. The leader of this project Lü Dafang (1027–1097) was from a local Chang’an family, and served as the governor of the Chang’an region when the map was made. His brother Lü Dalin (1044–1091), a famous antique collector, also participated in making corrections to drafts of the map. Therefore, Lü Dafang and his team must have been intimately familiar with the area and many of the ancient sites that were still visible.8 Given that the Lü family members have been engaged in archaeological investigations in the past, it is possible that the two brothers also excavated old sites in their making of the map of Chang’an.9 Therefore, this early map of Chang’an was created on the basis of textual evidence, earlier maps, ground surveys, and possibly even archaeological data.
Second, the method of incorporating these data on a two-dimensional surface is also revolutionary. For the core of the map — the Sui-Tang city and the three Tang palaces — the cartographers strived to represent them accurately by following a consistent scale of conversion, about 1:7,666. Within this core, information regarding specific places is included on the basis of textual information. For instance, for the Pingkang Ward to the northeast of the city, a ward renowned among the 110 or so wards in the city for its pleasure quarters, the map includes the name of the ward itself (Pingkang fang 平康坊) carved in the middle of the ward; the names of important sites are placed in different areas of the ward, including Buddhist monasteries and the residences of famous officials like Chu Suiliang (596–658). These sites are represented by a simple line drawing of a small house, reflecting the influence of Chinese painting at the time.10 In reality, however, each of these residences and monasteries must have consisted of many individual units of houses. Beyond the city core, areas were represented primarily for inclusion rather than precision.11 The entire southern suburb of the city, which stretched for about thirty to fifty kilometers from the southern wall of the Sui-Tang city to the Zhongnan mountains, was compressed into a narrow strip at the bottom of the map.
Figure 1. Pingkang Ward according to the Chang’an tu.Peking University Rubbing of the Map published in Tang Yanjiu, vol. 21 (2015), plate 2.13.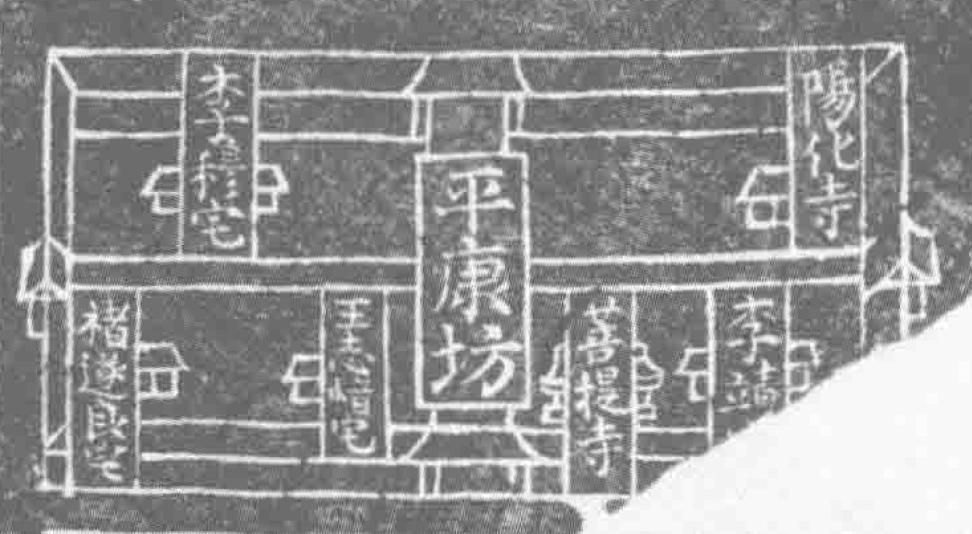
From this brief introduction, we can see that, although remarkably accurate in its representation of the basic structures of the city (the walls, palaces, wards, and locations of gates), this unprecedented accomplishment in the early history of Chinese cartography nevertheless falls short in capturing the full richness of the city of Chang’an in a number of ways. Due to spatial limitations, the cartographers can only include a number of the most important sites, and in a much simplified way. This one map also cannot represent the changes that occurred within the space of the city, but rather combines parts of the city the developed from different times and places them on the same map. For instance, the Daming Palace was not part of the city’s original plan but was instead built several decades into the Tang dynasty. In this way, the map is not an accurate reflection of the city at any specific time, but an atemporal picture. Finally, because of the need to produce a map that is largely square for easy viewing and reproduction, the cartographers had to sacrifice accuracy for areas outside of the city, and squeeze in as best they could places they deemed important. The result was a rather distorted picture of the areas around Chang’an.
Lü’s eleventh-century map remained the standard Chang’an map until the late twentieth century.
These issues with the otherwise revolutionary map would not be addressed, or perhaps even recognized, for centuries. The maps of Chang’an produced after Lü Dazhong’s map in the Southern Song through the Qing dynasties, though interesting in their own ways, were as a rule even less accurate and less rich than the Northern Song map.12 Therefore, Lü’s eleventh-century map remained the standard Chang’an map until the late twentieth century, when scholars began using newer technology to produce new kinds of maps of Chang’an. The culmination of such “modern” scholarship is the Historical Atlas of Xi’an (Xi’an lishi dituji) published by the historical geographer Shi Nianhai in 1996.13 Shi’s atlas contains eighty-nine maps of the Xi’an region from Neolithic times down to the late twentieth century. It is arranged chronologically, with an emphasis on the Han and Tang dynasties. In particular, there are twenty maps of the Sui-Tang city, which account for almost a quarter of the whole atlas.
In important ways, this atlas followed the practice of Lü Dazhong’s map. It included maps of the Sui-Tang city itself, but also maps of the three Tang palaces.14 But it also addressed the issues of Lü Dazhong’s map in several ways. For the city itself, the 1996 atlas included several kinds of maps, such as a map of residential units, one on commercial establishments, one on religious institutions, and one on gardens, wells, canals, and springs.15 In this way, it contained a significantly richer array of information than the eleventh-century map. By presenting three maps (Sui dynasty Chang’an, early Tang Chang’an before 755, and late Tang Chang’an after 756), the atlas tries to capture the historical changes of the urban space in the three centuries of the Sui-Tang empire.16 Finally, instead of squeezing the suburban areas into the margins of the main maps, the atlas uses separate maps to represent the southern suburb, an area of villas and monasteries, and the northern suburb, where one finds all the Tang imperial mausoleums. These maps do not use distorted proportions, and are thus more accurate representations of the city and its relation to its environs.17
The most notable innovation of this atlas compared to traditional maps is its treatment of archaeological materials. In addition to maps and their accompanying, brief textual explanations, this atlas includes many photographs of archaeological sites — places of importance that were still visible to visitors — and archaeological finds. We find images of the ruins of the Han city,18 as well as treasures found in the Tang city and the surrounding Tang tombs.19 Uniquely, for the map of the Daming Palace, a site that has been thoroughly excavated, Shi Nianhai and his team include two maps: one based on textual information and the other on archaeological data.20 While they conform to each other to a large extent, the archaeological map includes more concrete shapes of buildings and the textual map contains many more names of places. The mapmakers indicate, subtly perhaps, that the job of future scholars is to further correlate these two groups of sources, both deemed important to the reconstruction of the city of Chang’an.
The Song cartographers’ treatment of the relation between these two cities reveals a more intimate, and less rigid, understanding of the geographical dimensions of historical change.
In certain ways, one may argue that the Song dynasty map remains superior in recreating the city to the much more voluminous and accurate 1996 atlas. The Song map’s attempt at drawing out the shape of the buildings and gates was largely abandoned in the atlas, where most monasteries were represented by a black dot and residences by a small square. This latter approach might be more cautious, but it also renders the image of the map dull and introduces inaccuracies in its own way. (The Buddhist monasteries were of course not just dots.) More importantly, the Song map includes the Han city to the northwest as an integral part of the Tang city, while the 1996 atlas separates the Han and the Tang cities, representing them in different sections of book. But in the Tang dynasty, the Han city was still prominently visible and frequently visited by Tang emperors. So the Song cartographers’ treatment of the relation between these two cities reveals a more intimate, and less rigid, understanding of the geographical dimensions of historical change.
There are other efforts to improve upon both the Song and the Shi Nianhai maps. In particular, the works by Heng Chye Kiang and Seo Tatsuhiko contributed significantly to the ways we reimagine Chang’an. Heng published a digital reconstruction of the city that, for the first time in history, transformed our view of the city into a 3D one, thus revealing the scale of the city in ways that are impossible for traditional maps.21 Seo, on the other hand, followed a traditional format but, by using color coding, thematic arrangements, and geographical correlation — one of his maps connects the places of residence and places of burial for residents of Chang’an — produced the most aesthetically pleasing and scholarly useful maps to date.22 Their work represents the best of existing scholarship on mapping Chang’an.
Toward a Deep Map
The survey in the previous sections shows that, although there is an abundance of sophisticated scholarship on mapping historical Chang’an, the overwhelming majority of approaches follows a tradition of mapmaking that in some ways began with the eleventh-century Song dynasty map of Chang’an. These maps are, although extremely useful for certain purposes, static. Once a map is made, it becomes difficult to manipulate it and incorporate new data. On the other hand, unlike these traditional printed maps, “deep maps,” in the words of David J. Bodenhamer, are:
fluid cartographic representations that reveal the complex, contingent, and dynamic context of events within and across time and space. They express the results of research but the answers they provide are not final and the map itself is always open to revision. 23
To achieve such a fluid cartographic representation, “within and across time and space,” one needs to build a geotemporal database that can be queried, visualized, and regularly updated. The raw materials for such a database include primarily textual sources and archaeological data. To explain how I envision building this database, I will briefly examine the nature of these two kinds of data.
There is a long tradition of writing about the city in China, and the writing about Chang’an is at the heart of this tradition. The Sanfu huangtu, a work of uncertain date that contained information about early Chang’an but was likely compiled much later, offers a textual dissection of the city, listing the palaces, gardens, gates, and streets of the city in the Western Zhou and the Han dynasties.24 Under each heading, the book provides a short description of the place, including its location, its history, and famous anecdotes associated with it. This kind of thematic treatment is inherited by later geographies, such as the Leibian Chang’an zhi produced in the Yuan dynasty (1271–1368).25
There is a long tradition of writing about the city in China, and the writing about Chang’an is at the heart of this tradition.
Another related kind of local writing began with the Song dynasty Chang’an zhi, produced by Song Minqiu (1019–1079) in 1076.26 Song’s work includes a historical survey of the Chang’an area, including a summary of government institutions, palaces, and cities in the Zhou, the Qin, and the Han dynasties, as well as the city in the Tang dynasty and counties around Chang’an. This work is organized according to two different principles. First, the editor separates the materials between the city and the counties around it. Then, on the city, the book follows a chronological order, focusing on the Han and the Tang dynasty. Within the chapters on the city, it then includes textual information about the locations and history of notable sites. For example, the entry on the Pingkang Ward in the Tang city (represented above in the map excerpt, Figure 1) includes detailed information about several notable structures within the ward. An edition of the book printed in 1468 uses large characters to describe the name and location of these structures, while the smaller, double-line notes explain their history and incorporate stories about these places.
Figure 2. Pingkang Ward according to the Chang’an zhi (1076).Ming dynasty edition of Chang’an zhi printed by Heyang Shutang in 1468.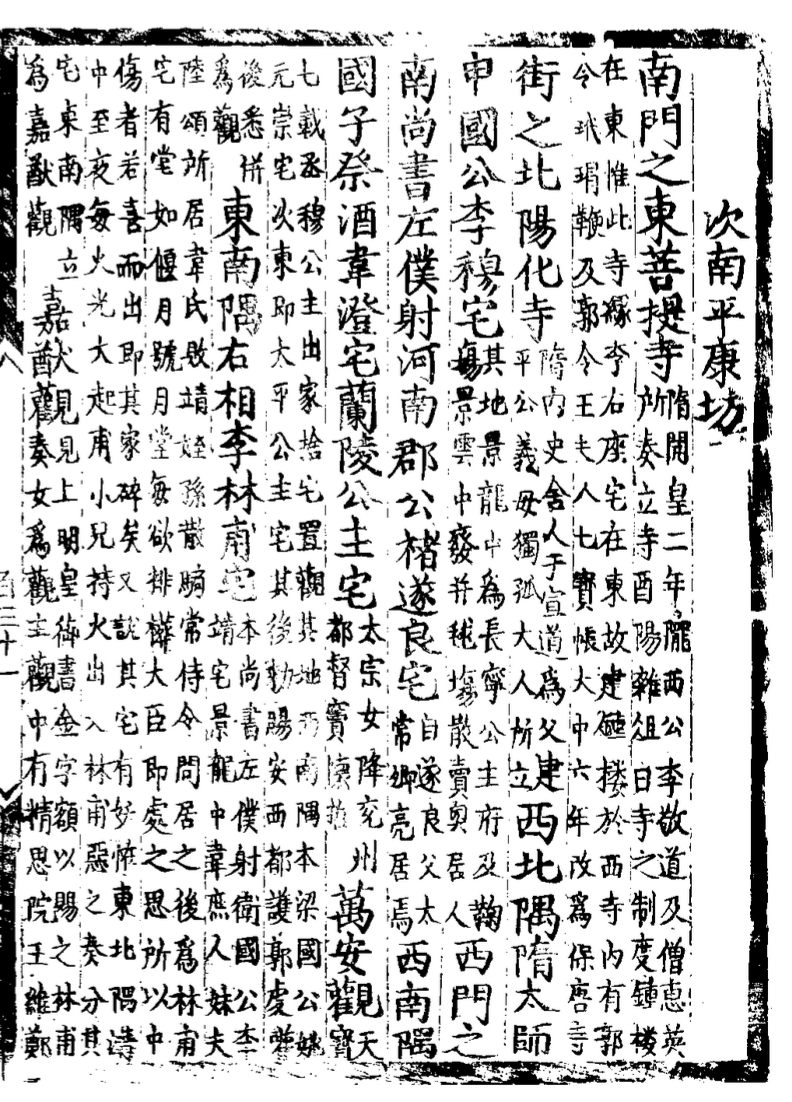
Therefore, unlike the thematically organized works mentioned above, the Chang’an zhi provides more concrete temporal and geographical information that can be associated with the texts it includes. For instance, we can “locate” the chunk of text about the residence of a notable historical figure geographically in a ward in the city, and temporally in the lifetime of this figure, which is often known or deducible from other sources. Because the Chang’an zhi provides the most complete list of Han and Tang place names in Chang’an and gives their location in a relatively concrete and reliable manner, it has long been the basis for the reconstruction of Chang’an in modern scholarship.27 I also use the Chang’an zhi as a basis for my reconstruction of the city (Figure 2).
| ID | Data Type | Name_Ch | Location | Time | Type | Sub-Type | Start Date | End Date | CAZ | CAZ-Len |
|---|---|---|---|---|---|---|---|---|---|---|
| 1001002 | Polygon | 開化坊 | 朱雀街東第一街 | Tang | Ward | Ward | 581 | 904 | 半巳南大薦福寺寺院半以東隋煬帝在藩舊宅武德中賜尚書左僕射蕭瑀西為園後瑀子鋭尚㐮城公主詔别營主第主辭以姑婦異居有乖禮則因固請乃取園地充主第又辭公主棨㦸不欲異門乃併施瑀之院門㐮城薨後官市為英王宅文明元年髙宗崩後百日立為大獻福寺度僧二百人以實之天授元年改為薦福寺中宗即位大加營飾自神龍以後翻譯佛經並於此寺寺東院有放生池周二百餘歩傳云即漢代洪池陂也西門之北法壽尼寺隋開皇六年立國子祭酒韓洄宅尚書左僕射令狐楚宅按酉陽雜爼楚宅在開化坊牡丹最盛而李商隱詩多言晉陽里第未詳户部尚書馬揔宅河東節度使兼侍中李光顔宅穆宗初賜第崇徳坊以為别宅尚書吏部侍郎沈傅師宅前司徒兼侍中崔垂休宅漕渠㑹要京兆尹韓朝宗分渭水入自金光門置潭於西市西街以貯材木又永泰二年京兆尹黎幹以京城薪炭不給鑿渠自京兆府直東至薦福寺東街北至國子監正東至子城東街並逾景風延喜門入苑 | 360 |
| 1001039 | Polygon | 東市 | 朱雀街東第四街 | Tang | Market | Market | 581 | 904 | 隋曰都㑹市南北居二坊之地東西南北各六百歩四靣各開二門定四靣街各廣百歩北街當皇城南之大街東出春明門廣狹不易於舊東西及南靣三街向内開北廣於舊街市内貨財二百二十行四靣立邸四方珍竒皆所積集萬年縣户口减於長安又公卿以下居止多在朱雀街東第宅所占甚多由是商賈所凑多歸西市西市户口少列律寛自此之外繁雜稍劣於西市矣當中東市局次東平准局並𨽻太府寺東北隅有放生池分滻水渠自道政坊東入城西流注此池俗號為海池 | 192 |
| 1001044 | Polygon | 修政坊 | 朱雀街東第四街 | Tang | Ward | Ward | 581 | 904 | 尚書右丞相張九齡宅尚書省亭子宗正寺亭子輦下嵗時記曰新進士牡丹宴或在于此 | 35 |
| 1001047 | Polygon | 十王宅 | 朱雀街東第五街 | Tang | Ward | Ward | 581 | 904 | 盡坊之地築八苑十王宅政要先天之後皇子㓜則居内東封後以年漸近長乃於安國寺東附苑城同為大宅分院居之名為十王宅令中官押之於夾城中起居每日家令進膳十王謂慶忠棣鄂榮光儀潁永濟也其後盛壽陳豐恒涼六王又就封入内宅天寳中唯十四王居内而府幕列於外坊嵗時通名起居而内外諸孫成長又於十宅外置字孫院十五宫人每院四百餘人百孫院三四百人又於宫中置維城庫諸王月俸物納之給用諸孫婚嫁亦就十宫中太子不居東宫但居於乘輿所幸别院太子之子亦分院而居婚嫁則同親王公主於崇仁坊之禮㑹院 | 221 |
| 1001063 | Polygon | 光行坊 | 朱雀街西第一街 | Tang | Ward | Ward | 581 | 904 | 行字本犯中宗諱長安中改一作光仁東南隅華州刺史宇文經野宅觀軍容使魚朝恩宅 | 35 |
| 1001078 | Polygon | 延壽坊 | 朱雀街西第三街 | Tang | Ward | Ward | 581 | 904 | 隋有惠覺寺大業七年廢南門之西懿徳寺本慈門寺隋開皇六年刑部尚書萬安公李圓通所立神龍元年中宗為懿徳太子追福改名加飾焉東南隅駙馬都尉裴巽宅其地本隋齊州刺史盧貴宅髙宗末禮部尚書裴行儉居之武太后時河内王武懿宗居之土地平敞水朩清茂為京城之最成安公主宅中宗女降韋㨗寳應經坊大厯十二年淮西節度兵馬使李重倩敗汴州李靈輝請捨所居延夀里宅為佛經坊許之仍賜名寳應一切經坊 | 173 |
| 1001091 | Polygon | 西市 | 朱雀街西第四街 | Tang | Market | Market | 581 | 904 | 隋曰利人市南北盡兩坊之地市内有西市局𨽻太府寺市内店肆如東市已制長安縣所領四萬餘户比萬年為多浮寄流寓不可勝計市西北有池長安中沙門法成所穿支分永安渠以注之以為放生池放生池平凖局獨柳刑人之所 | 93 |
| 1001097 | Polygon | 歸義坊 | 朱雀街西第四街 | Tang | Ward | Ward | 581 | 904 | 全一坊隋蜀王秀宅隋文帝以京城南面濶逺無以彈壓乃使諸子並南郭參居秀死後沒官為家令寺園 | 41 |
In addition to these geographical texts devoted to Chang’an, the vast ocean of traditional Chinese historical records includes many more sources for Chang’an: in official annals, political treatises, fictions, and poetry, among others. They are associable to different areas of the city because they often mention places in Chang’an as the location where the stories transpired. The Pingkang Ward, for instance, was renowned as the pleasure quarter of the city, and many encounters between courtesans and young officials and students are recorded.28 Now that I have established a database of places according to Chang’an zhi, information from these other sources can then be added to each record, enriching the dataset as a whole. The result, hopefully, will be an extensive database of textual sources that are, to various degrees of preciseness, locatable in the city of Chang’an.
The second kind of data we possess in abundance now comes from archaeology. Unlike textual sources, whose geographical information can often be fuzzy, archaeological data generally contain concrete geographical information. For instance, when a hoard of Tang treasures was discovered in 1970, we know precisely where it was discovered: a modern village called Hejiacun (Figure 4).29 Then, cross-referencing with textual sources from Chang’an zhi and others, we can determine that this hoard was located in the southwestern part of the Xinghua Ward on the west side of Chang’an.
Figure 4. A Golden Bowl from the Hejia Village Hoard. Artifacts like these allow us to link abstract textual descriptions of a place with their geographic location.Wikimedia Commons.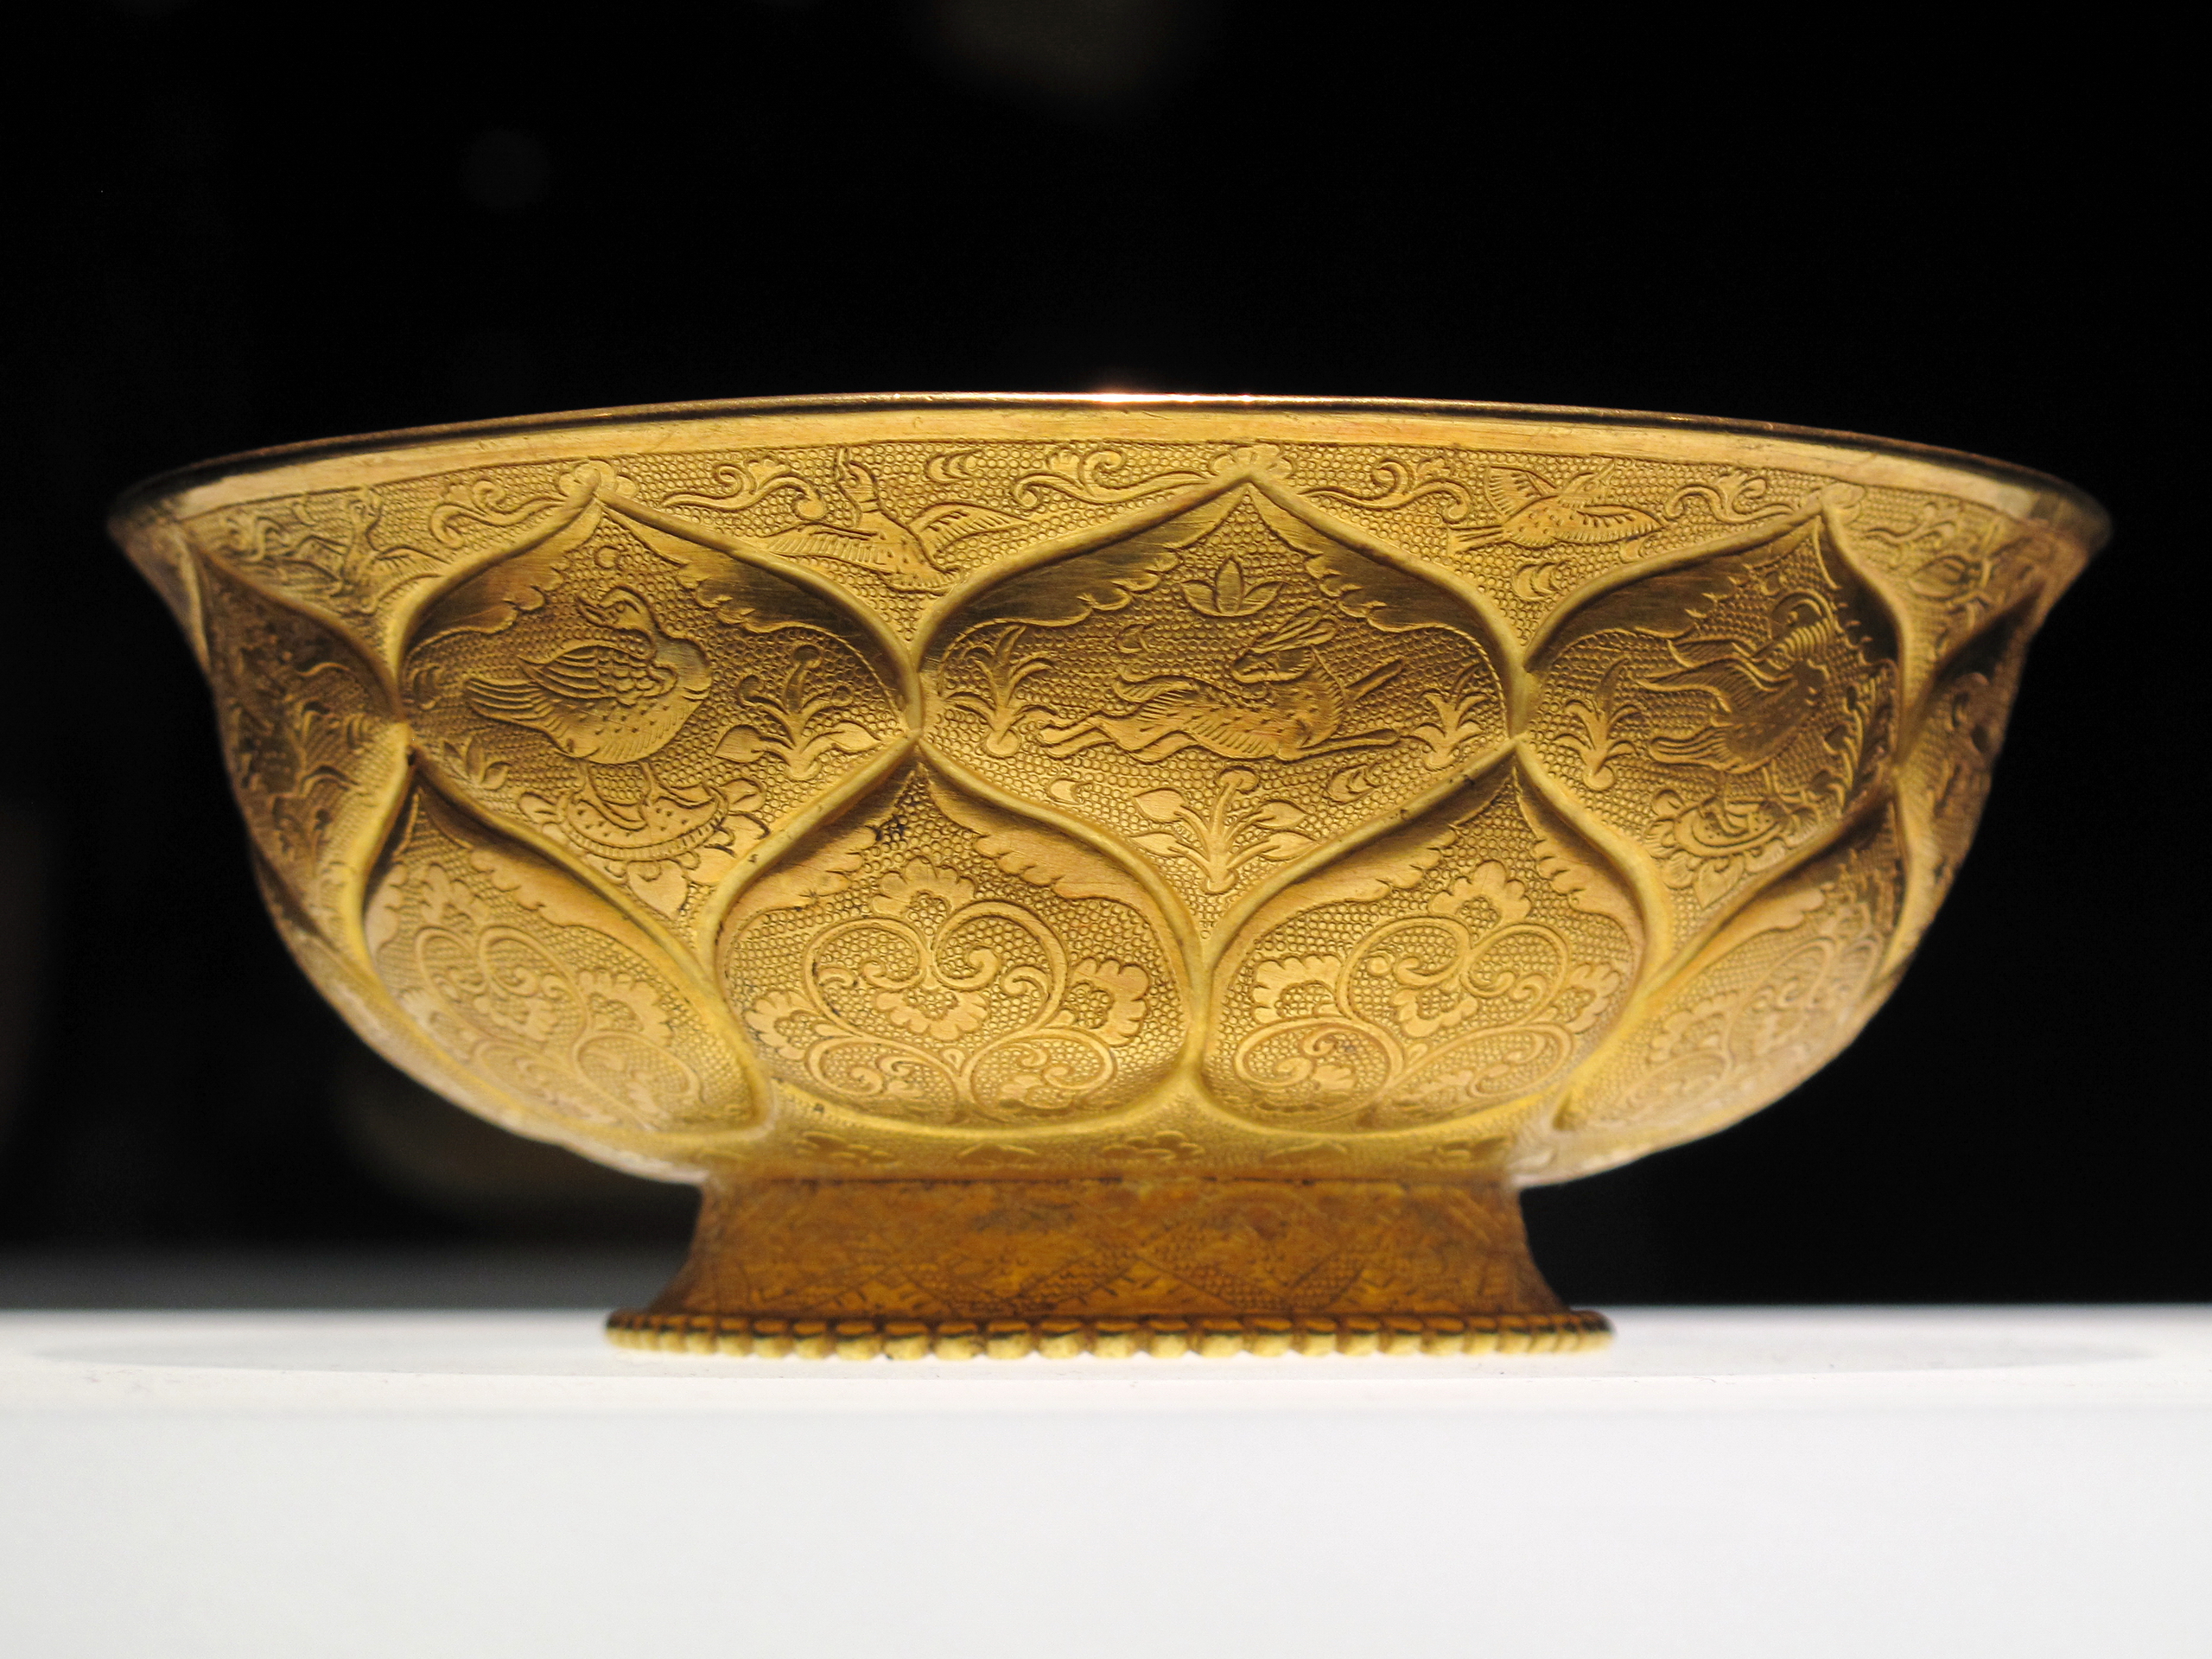
Thousands of similar archaeological discoveries, from tombs and building foundations to ancient wells and gates, have been made in the past few decades. Almost all of them, when documented in official reports, are placed with a precise location that can be associated with a Tang or Han dynasty place. In this way, these archaeological data can be easily connected to the textual database. Our knowledge about their precise locations means that these archaeological data more easily lend themselves to geometric abstractions than does most textual information.
Furthermore, archaeology does not simply provide additional data, but can help revise and refine the textual data too. The archaeological work on the city itself — its walls, gates, bridges, and palaces — gives us a more precise picture of the shape of the city than textual sources and offers details unrecorded in texts. For instance, the excavation of what used to be the Western Market — the center of foreign trade in Tang Chang’an — revealed details about the internal structure of the market area, including the bridges and water system that must have been crucial to the function of the city (Figure 5). None of these details are recorded in textual sources. Such archaeological data complement, correct, and enrich textual data; a full picture of the city can only become possible if both types of sources are thoroughly incorporated.
Figure 5. Excavation of a Stone Bridge in the Western Market of Tang Chang’an.Photo taken by the author.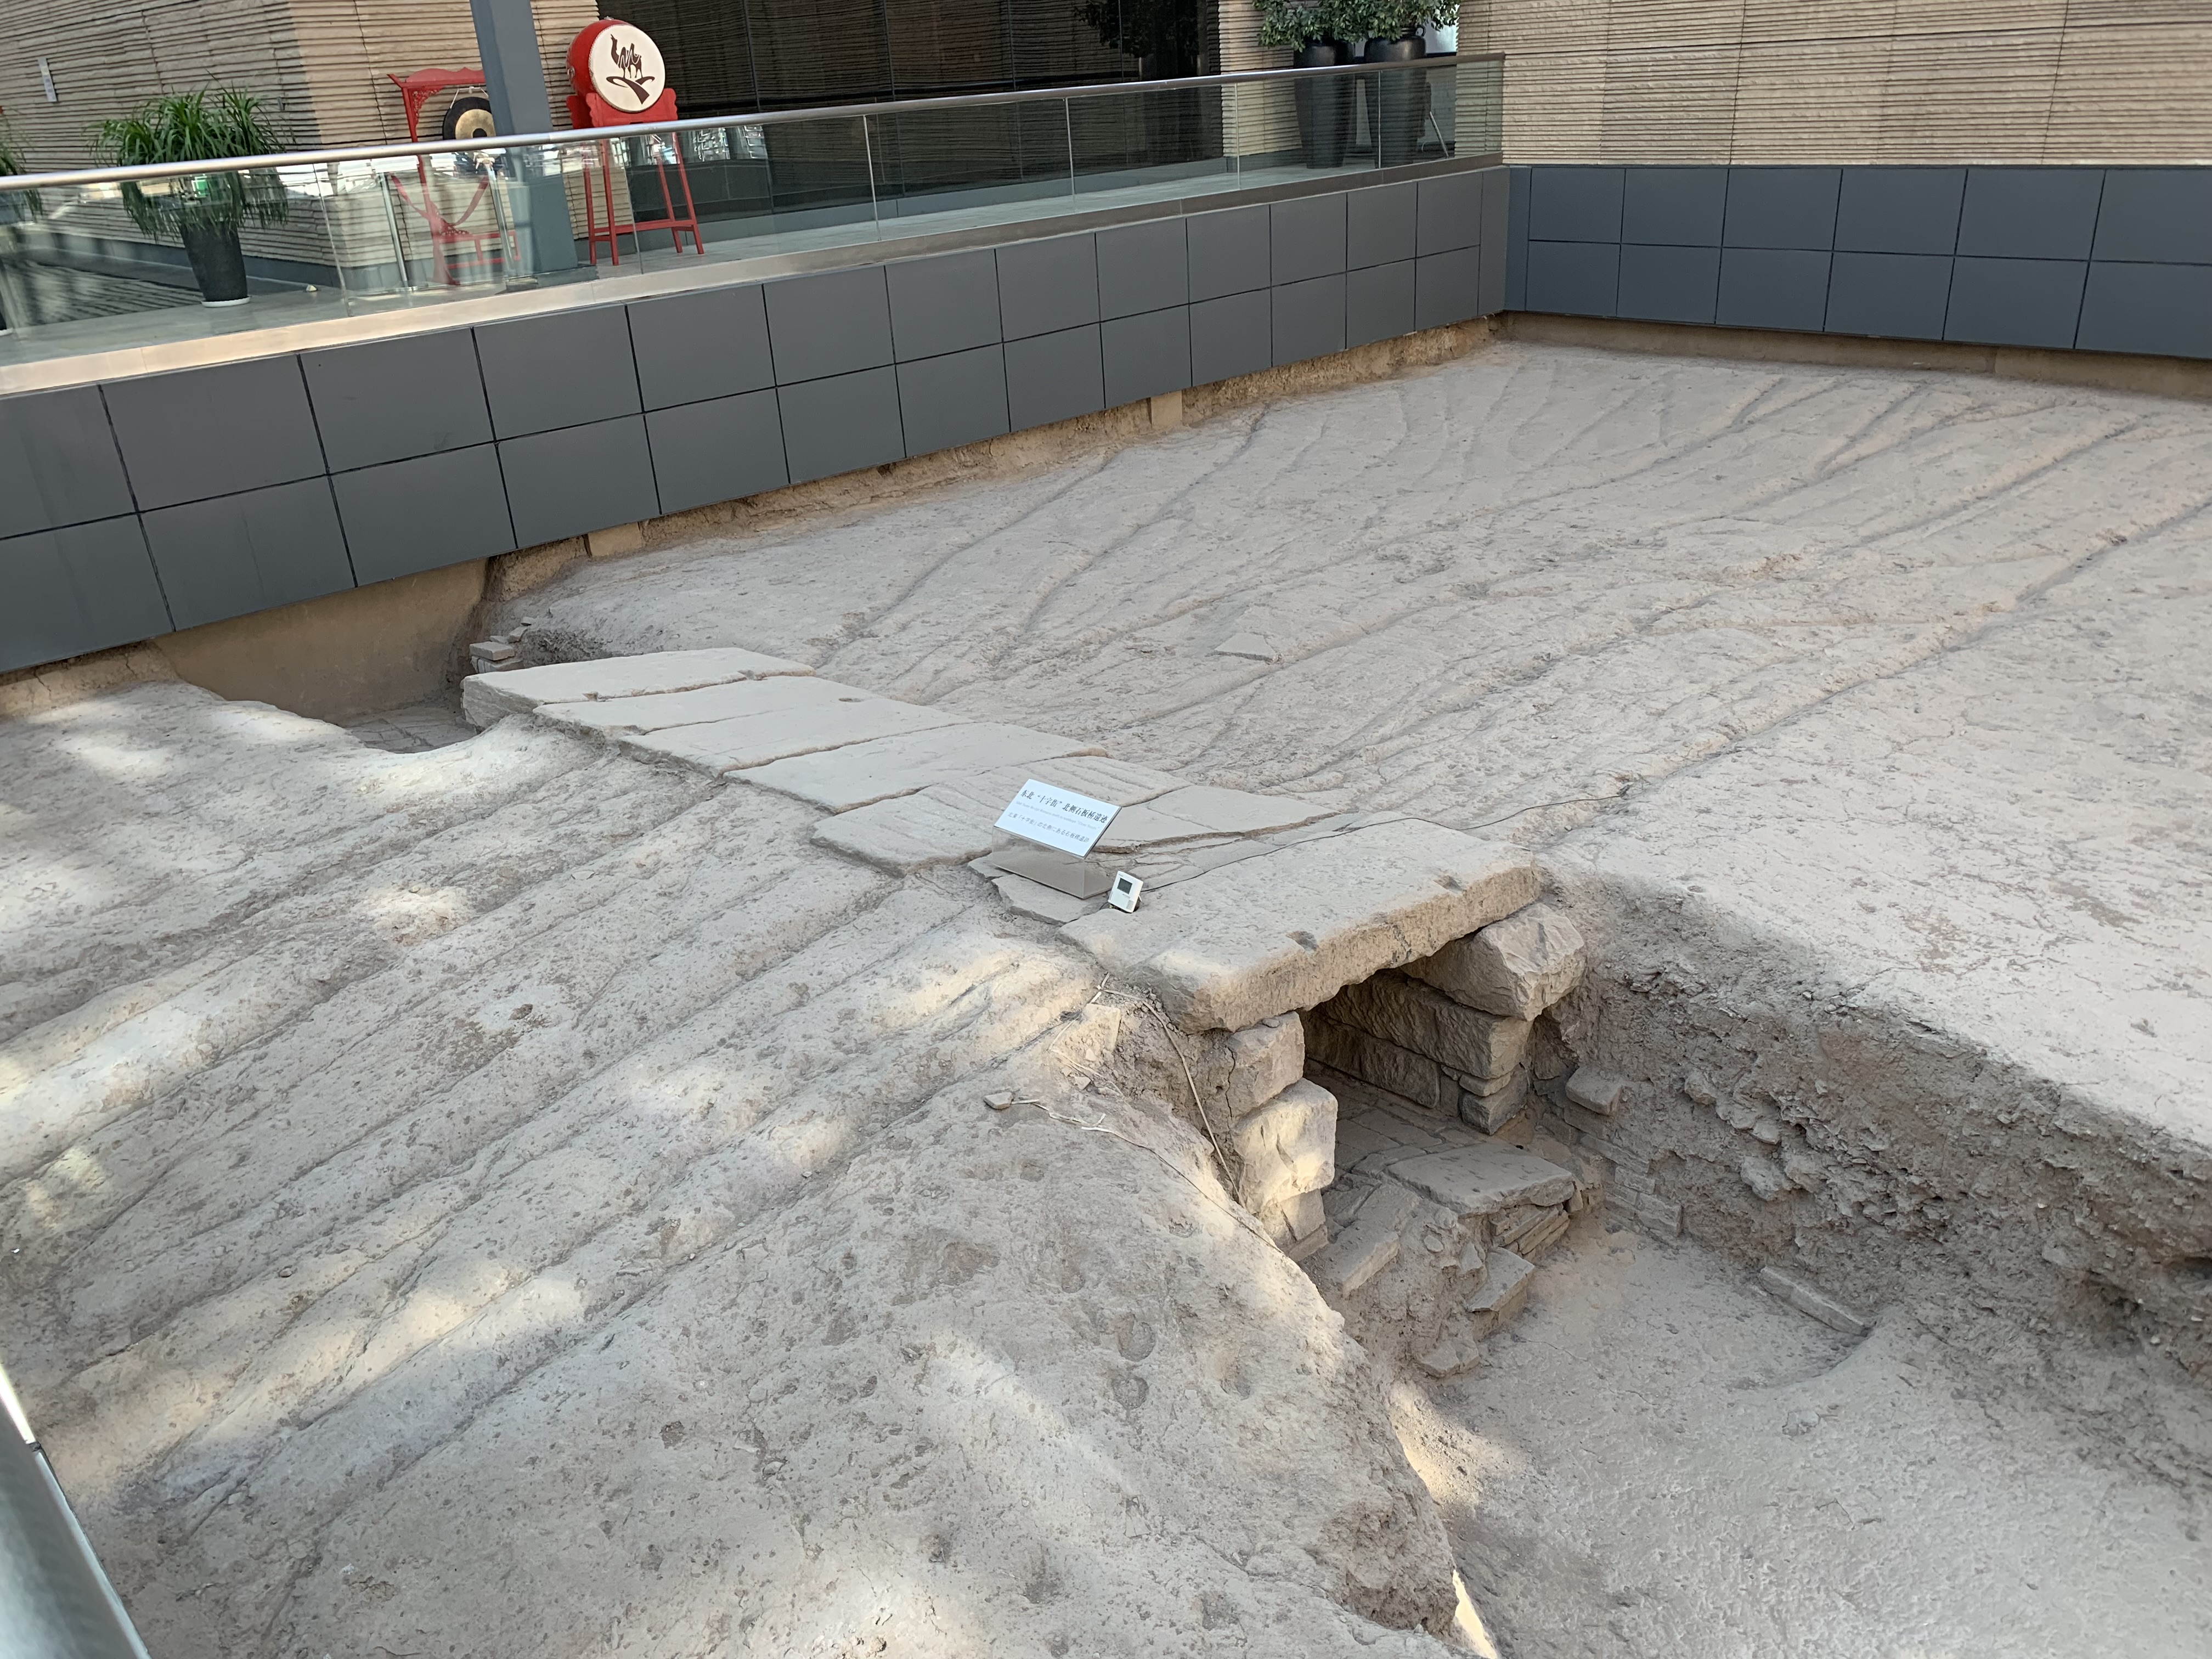
What can we do with a database that incorporates both textual and archaeological information? And how would this “deep map” differ from the existing maps surveyed above? At this point, in the beginning of my project, I can only offer a few conjectural remarks.
As I will be using GIS software like ArcGIS or QGIS to organize and visualize my data, the first step — by no means an easy one — is to produce a time-layered map of Chang’an, the scale of which can be easily manipulated through zooming-in and -out features. Unlike Shi Nianhai’s atlas, it is possible to create many more layers of different time periods, considering the changing political and cultural history of the city. The juxtaposition of maps from different eras could help readers better grasp the overlapping constructions in Chang’an across different dynasties, which formed a kind of imperial palimpsest. There will also be virtually no limit as to how much information one can include within a certain space. Going back to the Pingkang Ward example, unlike the Song dynasty map that can only include six building complexes, GIS technology allows us to put all the information contained in the Chang’an zhi and other sources under the entry of the “Pingkang Ward” in our database. This large amount of information can then be linked to specific locations on the map, showing either the names of specific buildings or even excerpts from the historical sources on these buildings. These annotations can be placed on a modern basemap like Google Earth’s satellite images, or a georeferenced old map like the fragments of the Song dynasty Chang’an tu. The result will be a Chang’an map of unprecedented detail.30
Another aspect of the urban space of Chang’an that most existing maps fail to grasp is its three dimensionality. As scholars have shown, the vertical space of Chang’an was a central factor in the social life of its residents.31 Yet virtually all our existing maps use a bird’s-eye perspective, looking down on a two-dimensional city. As we have knowledge about the magnitude of Chang’an’s tall buildings — some of the pagodas in Buddhist monasteries rose to over one hundred meters — and the topographical features of the city — the Tang imperial palace in the north was the lowest elevational point in the city, and was about fifty to sixty meters lower than the southeastern corner of the city — it will be possible to incorporate these data into the “deep map” and offer a better approximation of residents’ experiences of the city in premodern times.
Fictional accounts like the love story between a courtesan and an aspiring examinee also include factual geographical information that allows us to place the flow of their plots in the space of Chang’an.
What makes a map “fluid” is its ability to illustrate not only buildings and walls, but also events. There is of course no doubt that many historical events played out in the city since the earliest days of its foundation. But it was not until the Tang dynasty that significant events were recorded in textual sources with (relatively) precise geotemporal information. We know, for instance, how the Xuanwu Gate incident (July 2, 626), in which Li Shimin (598–649) killed his two brothers and forced his father (the emperor) to designate him as the heir, played out, beat by beat, in different parts of the city. Neither is such knowledge limited to historical events. Fictional accounts like the love story between a courtesan and an aspiring examinee also include factual geographical information that allows us to place the flow of their plots in the space of Chang’an.32 The social lives of certain residents and visitors, such as the Japanese Buddhist monk Ennin who visited Chang’an in the mid-ninth century, can also be reconstructed with remarkable precision.33 I plan to create subsets of data to document the flow of these events and show them in separate layers of maps. The data thus organized can then be animated, revealing the social lives of the city in ways impossible using printed maps.
Conclusion
This “deep map” of Chang’an will be useful for scholars and students to learn about the city and its history. The collection of a vast amount of textual and archaeological data with new ways to organize and visualize them will certainly lead to new insights into the history and culture of the city. I cannot foresee what these insights will be. In my own research, I have certainly already benefited from even thinking about this deep map: an article I am writing now discusses the continued presence, in Tang Chang’an, of physical structures and ghostly beings from the Han dynasty and earlier. The idea for this project came directly from when I tried to overlay the Han city map onto the Tang city map in QGIS. I hope this deep map will be similarly useful to other scholars in their research work.
As Chang’an was the capital of China in much of the early and medieval imperial period, a better understanding of the city also would lead to a more intimate knowledge about Chinese history in general. In this sense, a more dynamic and accessible deep map of Chang’an will no doubt be of pedagogical value and should be welcome in classrooms of Chinese history and culture, both in introductory lectures and in specialized seminars. A deep map of historical Chang’an, if combined with portable GPS devices, will give travelers an augmented experience that no print map can match. These multiple potential uses make this deep map a worthwhile endeavor, and I look forward to the collaboration with other students of China and Chang’an in the coming years on this project.
The earliest reference to a map of Chang’an is found in a third-century commentary by a certain Ruchun 如淳 on the Han dynasty work Shiji. See Sima Qian 司馬遷, Shiji 史記 (Beijing: Zhonghua shuju, 1982), 10.432. This reference indicates that it is highly likely a map of Chang’an already existed in the Han dynasty. ↩︎
These maps were preserved because they were carved on stone. The stone that carried the main map of the city had long been severely damaged, so only fragments of the map of the city are still extant. For a reconstruction of this map using rubbings, see Hu Haifan 胡海帆, “Beijing daxue tushuguan cang Lü Dafang Chang’an tu canshi taben de chubu yanjiu"北京大學圖書館藏呂大防《長安圖》殘石拓本的初步研究, Tang yanjiu 21 (2016), 1–63. ↩︎
See Joseph R. Dennis, Writing, Publishing, and Reading Local Gazetteers in Imperial China, 1100–1700 (Cambridge, MA: Harvard University Asia Center, 2015). ↩︎
The most authoritative work in this category remains Shi Nianhai 史念海, Xi’an lishi dituji 西安歷史地圖集 (Xi’an: Xi’an ditu chubanshe, 1996). But see also maps in Seo Tatsuhiko 妹尾達彥, Chōan no toshi keikaku 長安の都市計画 (Tokyo: Kōdansha, 2001). ↩︎
See the report of Huaxi dushi bao, https://www.wccdaily.com.cn/shtml/hxdsb/20230705/197867.shtml, accessed July 30, 2023. ↩︎
The colophon of this map is preserved only partially through the carved map itself. But a rough transcription of it is found in the Southern Song biji titled Yunlu manchao 雲麓漫鈔 by Zhao Yanruo 趙彥若 (1033–1095). For the fragmentary version on the stone, see Li Fangyao 李芳瑤, “Chang’an tubei xinkao 長安圖碑新考,” Wenxian 2012.3, 93. For the version in Yunlu manchao, see Yang Xiaochun 楊曉春 “Yunlu manchao zhong de yize Sui Tang Chang’an yanjiu zhengui shiliao de jiaodian,” 雲麓漫鈔中一則隋唐長安研究珍貴史料的校點 Zhongguo lishi dili luncong 20, no. 3 (2005): 144–50. I combine these two versions in my reading. ↩︎
This work still exists in fragments. See Wei Shu 韋述*, Liangjing xinji jijiao* 兩京新記輯校 ed. Xin Deyong 辛德勇 (Xi’an: Sanqin chubanshe, 2006). ↩︎
See my forthcoming article, “The Song Discovery of Chang’an,” Journal of Song Yuan Studies. ↩︎
This is known from the many antique objects, which were discovered from ancient sites many centuries before the time of the Lü family, buried in the recently discovered Lü family graveyard. See Shaanxi sheng kaogu yanjiuyuan 陝西省考古研究院 “Shaanxi Lantian xian Wulitou Bei Song Lüshi jiazu mudi 陝西藍田縣五里頭北宋呂氏家族墓地,” Kaogu 8 (2010): 46–52. ↩︎
Indeed, the distinction between a painting and a map was often quite blurred in premodern China. ↩︎
Yan Shaofei 嚴少飛, Wang Shusheng 王樹聲, Li Xiaolong 李小龍, “Neizhe wairong: yizhong rouhe ziran shanshui huanjing de chengshi tuhui moshi” 內折外容:一種糅合自然山水環境的城市圖繪模式, Chengshi guihua 11 (2017). ↩︎
Some of these maps are included in the late twelfth-century work Yonglu. See Cheng Dachang 程大昌, Yonglu 雍錄 (Xi’an: Shaanxi shifan daxue chubanshe, 1996). ↩︎
The first edition of the book was published in 1986, but here I use the later and updated edition. ↩︎
Shi, Xi’an lishi dituji, 87–90. ↩︎
Shi, Xi’an lishi dituji, 92–98. ↩︎
Shi, Xi’an lishi dituji, 74–75, 80–83. ↩︎
Shi, Xi’an lishi dituji, 99–106. ↩︎
Shi, Xi’an lishi dituji, 60. ↩︎
Shi, Xi’an lishi dituji, 86. ↩︎
Shi, Xi’an lishi dituji, 89. ↩︎
Heng Chye Kiang, A Digital Reconstruction of Tang Chang’an (Beijing: Zhongguo Jianzhu Gongye Chubanshe, 2006). ↩︎
His maps are scattered through his numerous publications, but notably Seo Tatsuhiko, Chōan no toshi keikaku, and グローバル・ヒストリGurōbaru hisutorī (Hachiōji: Chūō Daigaku Shuppanbu 2018). ↩︎
David J. Bodenhamer, “The Varieties of Deep Maps,” in Making Deep Maps: Foundations, Approaches, and Methods, ed. David J. Bodenhamer, John Corrigan, and Trevor M. Harris (Abingdon: Routledge, 2022), 6–7. ↩︎
He Qinggu 何清谷, Sanfu huangtu jiaoshi 三輔黃圖校釋 (Beijing: Zhonghua shuju, 2012). ↩︎
Luo Tianxiang 駱天驤, Leibian Chang’an zhi 類編長安志 (Beijing: Zhonghua shuju, 1990). ↩︎
Xin Deyong 辛德勇 and Lang Jie 郎潔 ed., Chang’an zhi, Chang’an zhi tu 長安志, 長安志圖 (Xi’an: Sanqin chubanshe, 2013). ↩︎
Such reconstruction work was started by Xu Song 徐松 (1781–1848) in the early nineteenth century. See Xu Song, Tang liangjing chengfangkao 唐兩京城坊考 (Beijing: Zhonghua shuju, 1985). Li Jianchao 李建超 has systematically added new, especially archaeological, information and produced several new expanded editions of Xu’s work. For the latest edition, see Li, Zuixin zengding Tang liangjing chengfangkao 最新增訂唐兩京城坊考 (Xi’an: Sanqin chubanshe, 2019). ↩︎
For a translation of this text, see Howard Levy, “The Gay Quarters of Ch’ang-an,” Orient/West 7, no. 9 (1962): 93–105; 8, no. 6 (1963): 15–22; 9, no. 1 (1964): 3–10. ↩︎
Valerie Hansen, “The Hejia Village Hoard: A Snapshot of China’s Silk Road Trade,” Orientations 34, no. 2 (February 2003), 14–19. ↩︎
In this regard, I have been inspired by the work of David Gilman Romano on Augustan Rome. David Gilman Romano, “Digital Augustan Rome,” University of Arizona, accessed September 10, 2023, https://www.digitalaugustanrome.org. ↩︎
Linda Rui-Feng, “Negotiating Vertical Space: Walls, Vistas, and the Topographical Imagination.” T’ang Studies 29 (2011): 27–44, https://doi.org/10.1353/tan.2011.0002. ↩︎
Glen Dudbridge, The Tale of Li Wa, Study and Critical Edition of a Chinese Story from the Ninth Century (London: Ithaca Press, 1983). ↩︎
Seo Tatsuhiko, “Buddhism and Commerce in Ninth-Century Chang’an: A study of Ennin’s Nittō Guhō Junrei Kōki 入唐求法巡禮行記,” Studies in Chinese Religions 5, no. 2 (2019): 85–104. ↩︎